Manual exports
Sales or transaction data had to be pulled repeatedly before reporting.
Case study
The client needed sales and transaction data to appear reliably in Google Looker Studio. I built an AWS Glue ETL job that joins transaction, product, branch, category, manufacturer, and ecommerce order data, then loads a reporting-ready dataset without repeated manual exports.
Overview
The solution automated the movement of raw operational data into a clean reporting structure that Looker Studio could use for dashboards and performance visibility.
The business problem
Sales reporting needed more than one table. Transaction records had to be connected with product, branch, category, manufacturer, pricing, and ecommerce order details before the data became useful for dashboards.
Sales or transaction data had to be pulled repeatedly before reporting.
Raw transaction data was not always ready for clean dashboard reporting.
Looker Studio visibility depended on whether the latest data had been prepared.
Transactions needed context from products, listings, branches, categories, manufacturers, and ecommerce orders.
Reports needed to exclude deleted transactions so dashboard numbers stayed cleaner.
The final dataset needed to be written in a stable format that could support recurring dashboard refreshes.
Challenges
Solution
I created an AWS Glue ETL job that reads operational data from the data catalog, joins the relevant business tables, filters out deleted transactions, and produces a single reporting dataset for sales visibility.
The transformed dataset includes transaction identifiers, branch details, product names, category and manufacturer context, listing status, pricing fields, ecommerce delivery fields, and the date the transaction was encoded.
The job writes a compressed Parquet output to reporting storage, with a basic data quality check and Glue observability enabled so the pipeline is easier to monitor and maintain.
System architecture
The architecture connects cataloged source tables, SQL transformation, data quality checks, reporting storage, and Looker Studio consumption.
Business results
Technologies
Gallery
The screenshots show source data flowing through AWS Glue, SQL transformation, S3 output, and a sanitized Looker Studio dashboard.

The Glue job connects multiple cataloged source tables, runs the SQL transformation, and writes the reporting output to S3 for dashboard consumption.
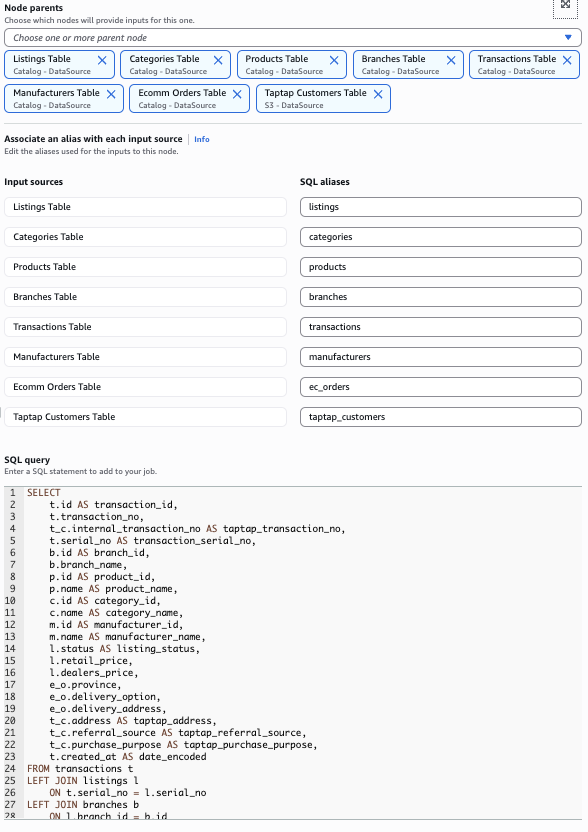
The transformation joins transaction, product, branch, category, manufacturer, listing, and ecommerce context into one reporting-ready dataset.
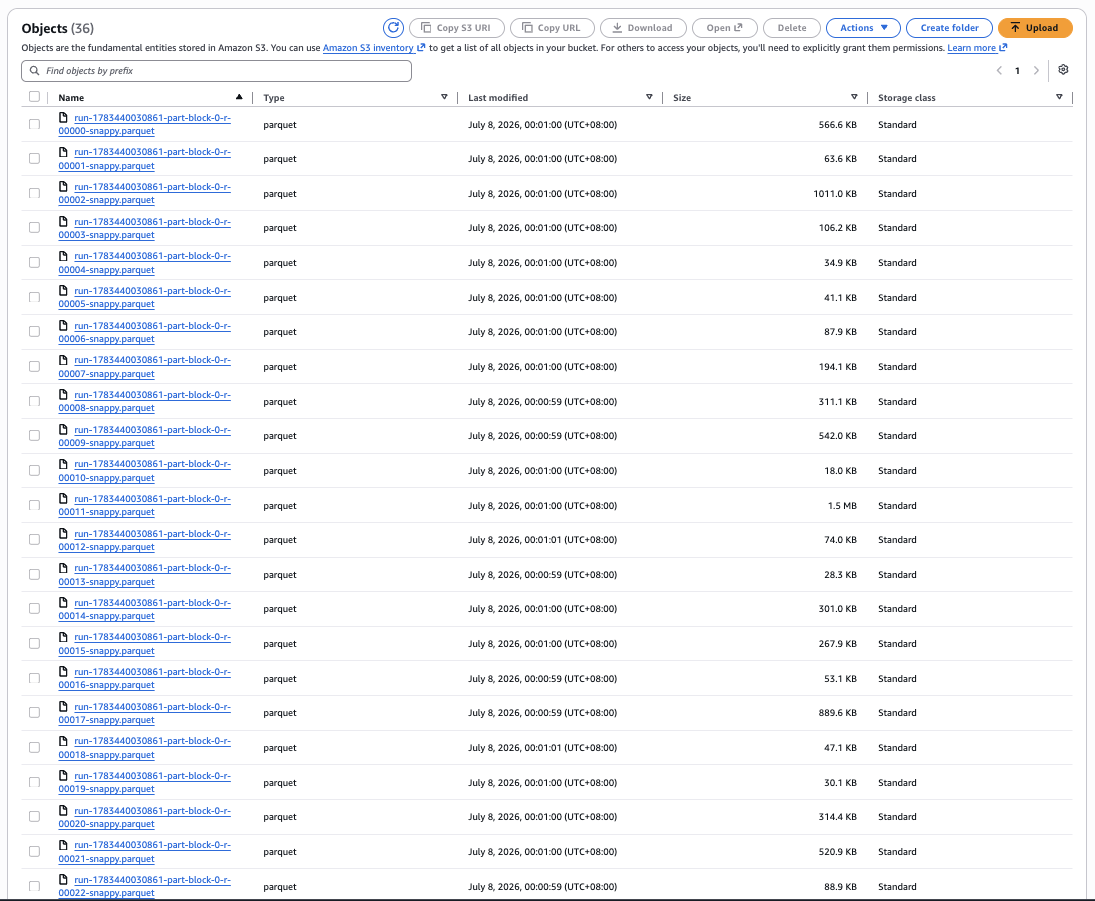
The job writes generated Parquet files to reporting storage, creating a repeatable data source for dashboards instead of manual exports.
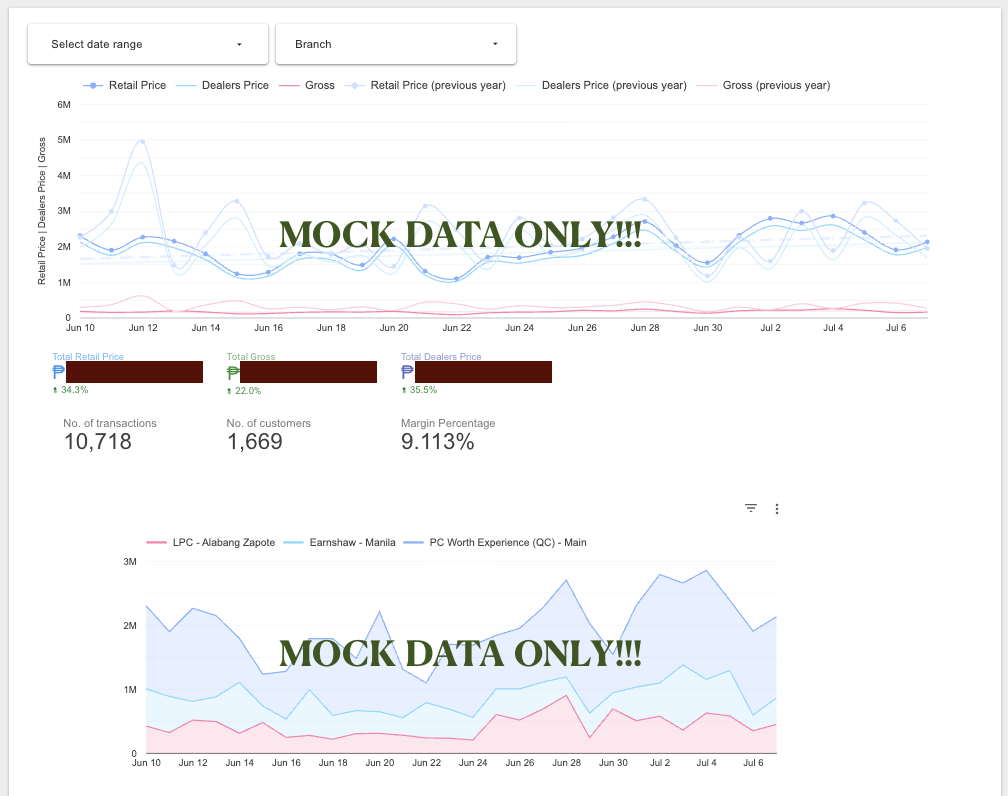
The dashboard consumes the automated dataset so decision-makers can inspect sales movement, branch performance, transactions, customers, and margin without rebuilding the data manually.
Why this matters
The solution turned repeated reporting preparation into a managed data pipeline that made sales visibility easier to maintain and more useful for dashboard decisions.
Book a free discovery call and we will identify whether automation can reduce repetitive work in your business.
Book My Free Discovery Call